AI-powered field boundary extraction that transforms weeks of manual work into seconds of automated precision.
AutoBounds leverages the groundbreaking Delineate-Anything research, a collaborative effort between the European Space Agency, University of Maryland, and other leading institutions. This breakthrough reformulates field boundary detection as an instance segmentation problem, achieving unprecedented accuracy across diverse agricultural environments.
Research Impact: 88.5% improvement in detection accuracy with resolution-agnostic performance from 0.25m to 10m satellite imagery.
Built upon peer-reviewed research from leading AI institutions
Real-time field boundary processing with optimized inference pipeline
Trained on 22.9 million field instances across 673K satellite image patches
Works from 0.25m to 10m resolution across global agricultural regions
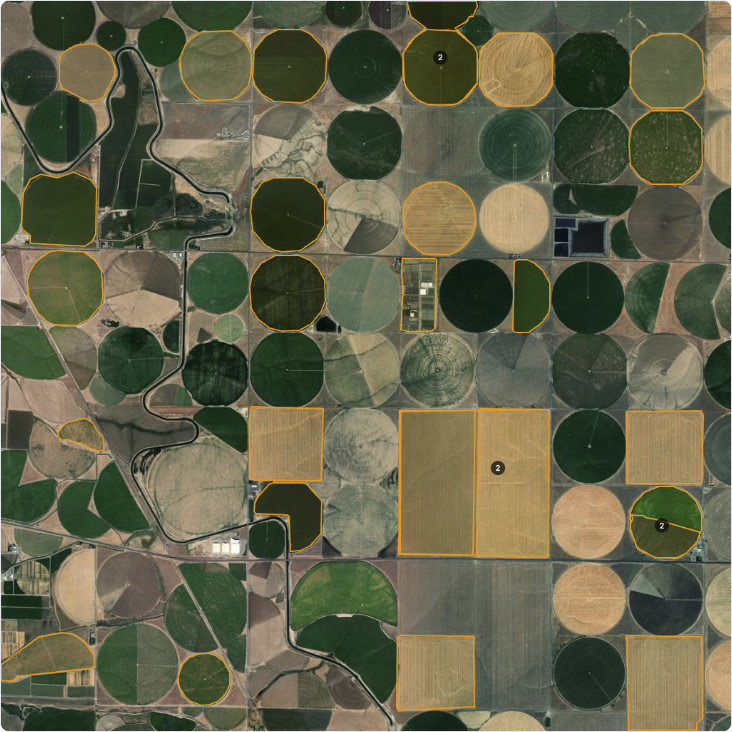
Real comparison from our internal testing lab showing field boundary detection across different AI models
Our Lab Setup: We test each model on the same agricultural imagery using standardized hardware and processing pipelines to ensure fair comparisons.
Important Note: This comparison is intentionally simplified for demonstration purposes. We're showing results from a single representative image using one model variant per system, and not necessarily the optimal parameters for each model. Real-world performance may vary significantly based on image characteristics, parameter tuning, and specific use cases.
Vision-language model approach

| Model | Polygons Detected | Processing Time | Quality |
|---|---|---|---|
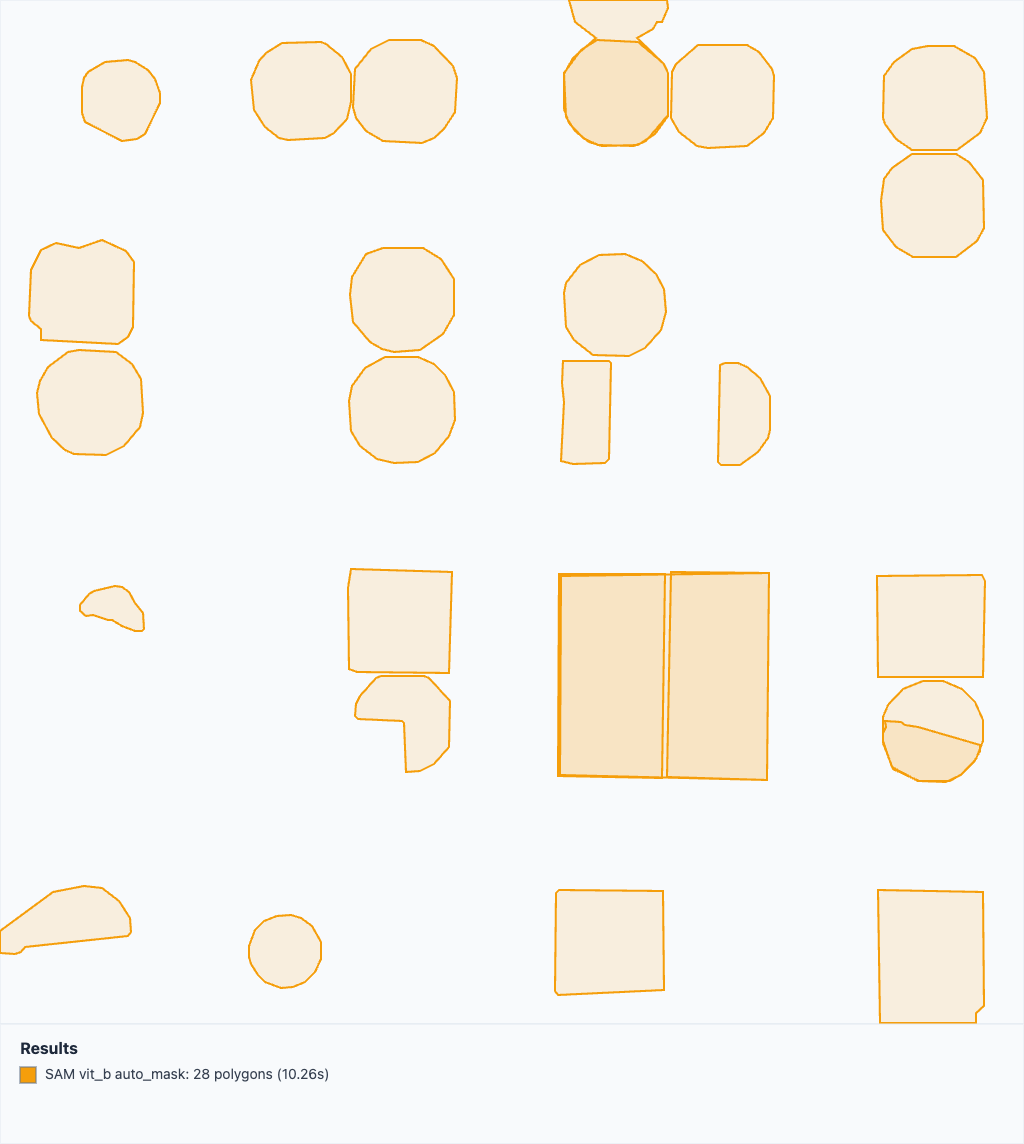
| SAM1-Geo | 28 | 9.95s | Good |
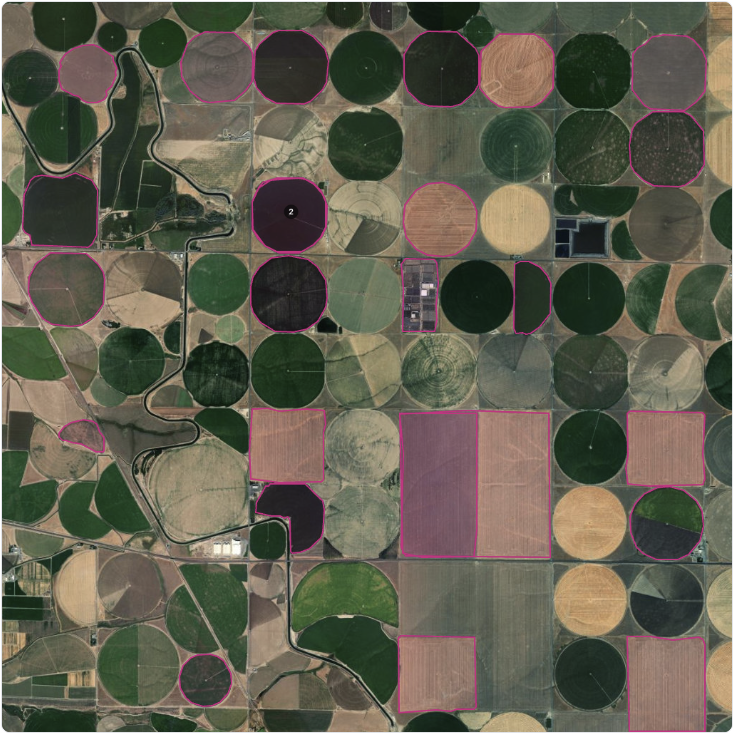
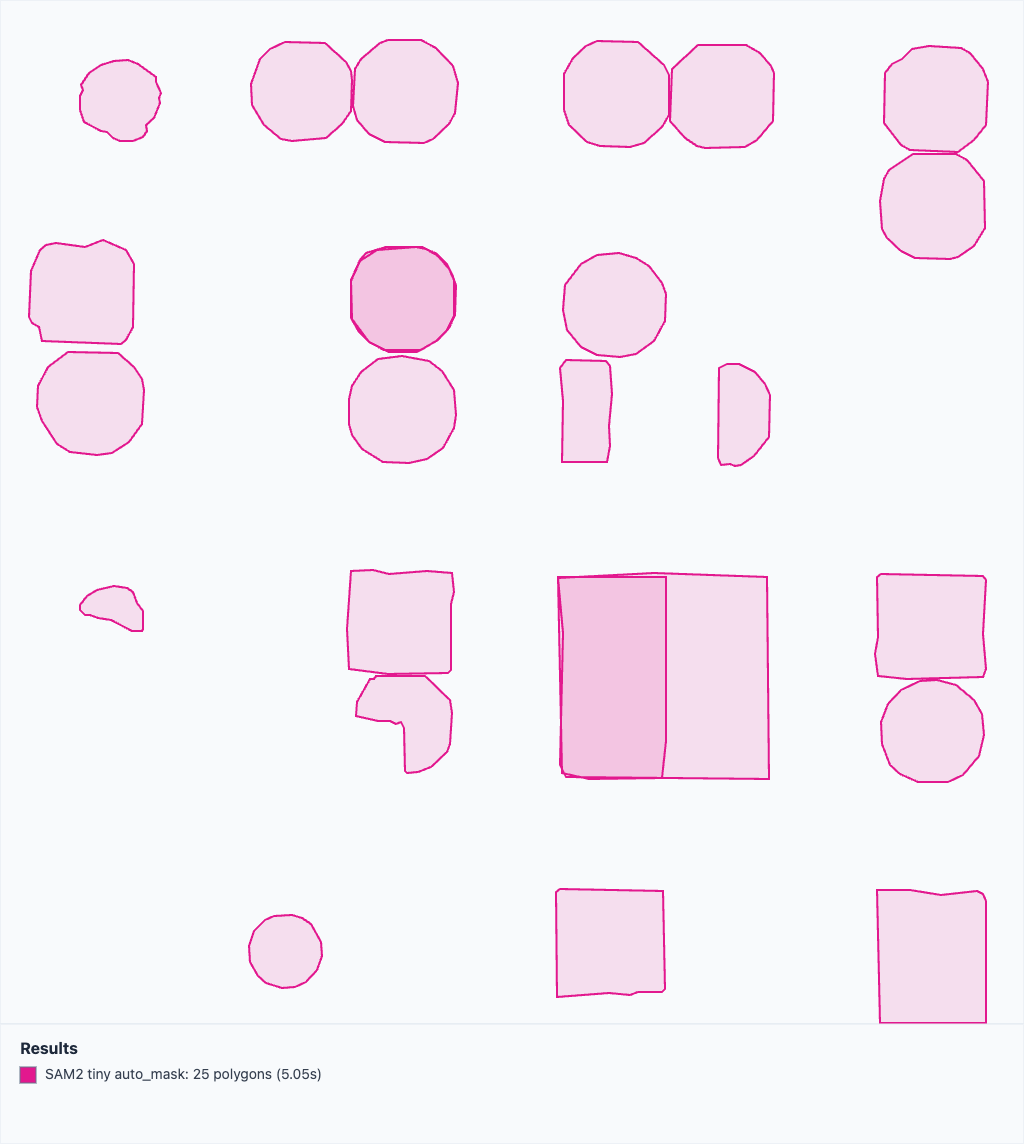
| SAM2 | 25 | 3.41s | Good |
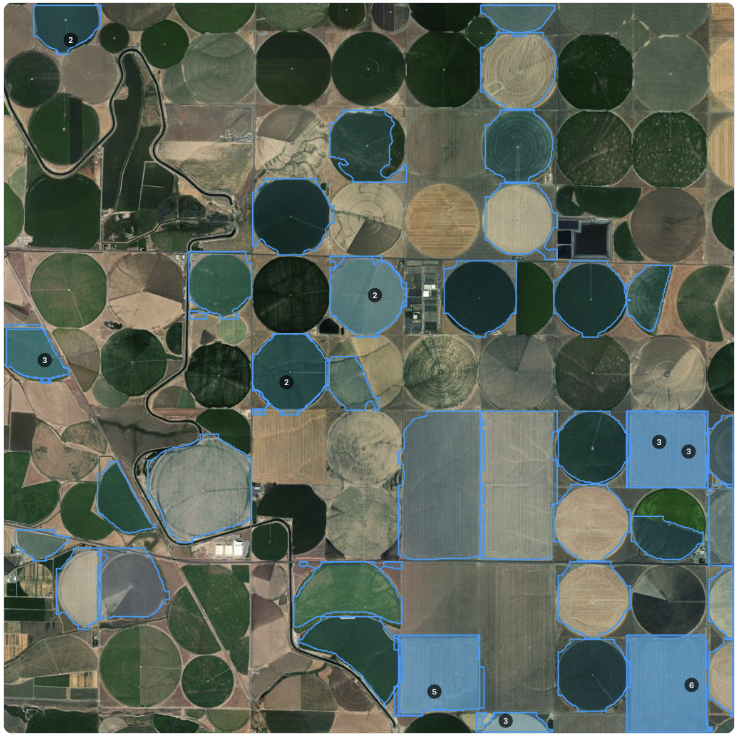
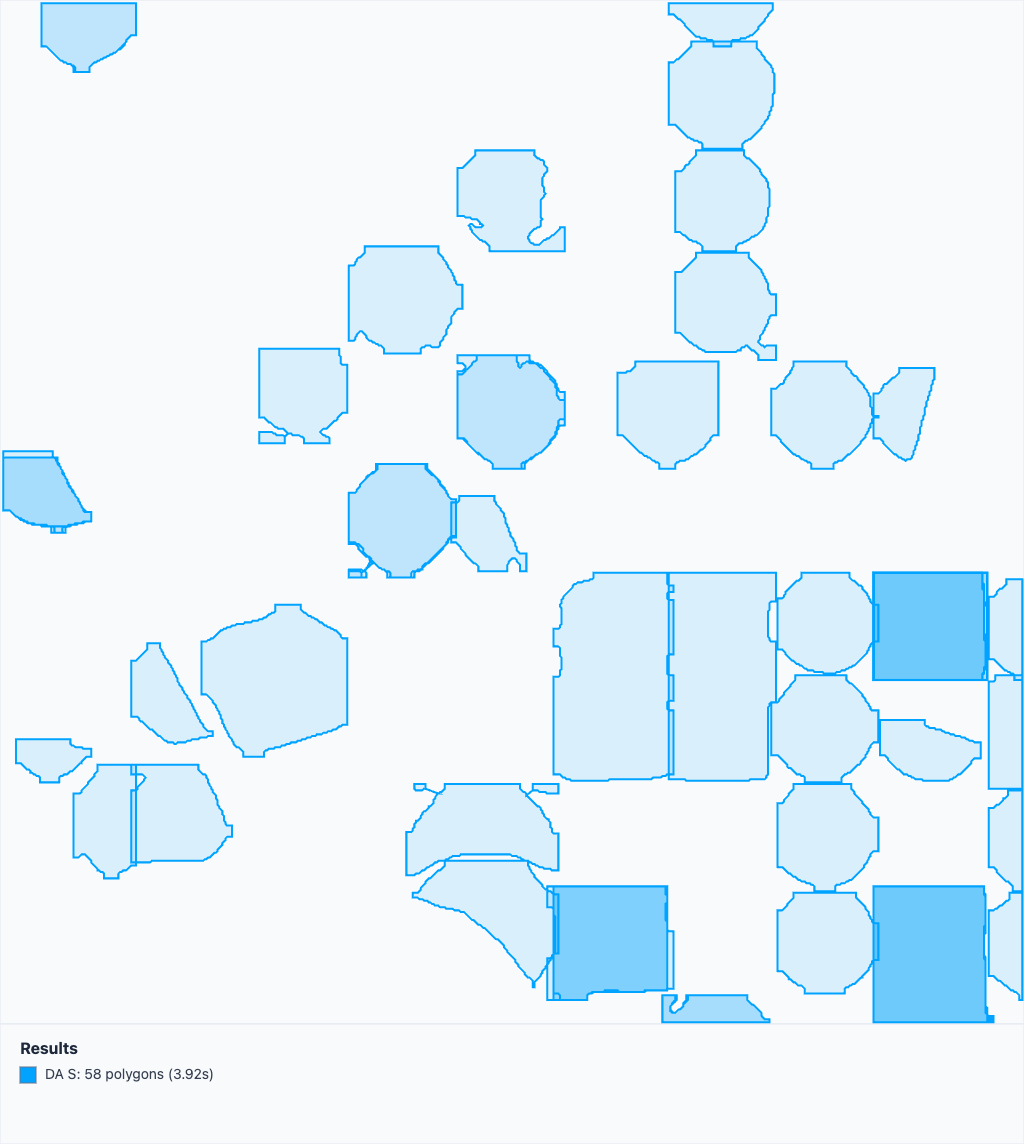
| Delineate-Anything | 58 | 4.09s | Moderate-Good-Great |
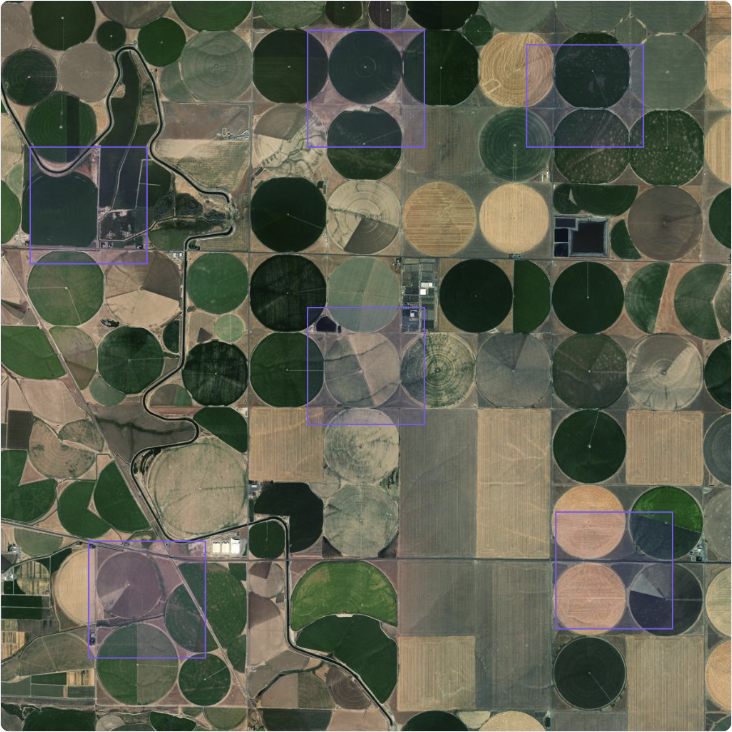
| GenAI (OpenAI gpt-5-nano) | 8 | 19.26s | Low |
Note: Higher polygon count doesn't always mean better quality. AutoBounds focuses on accurate field boundary detection rather than over-segmentation.
Test Context: Results shown are from Washington State, USA agricultural imagery. The Delineate-Anything model was primarily trained on European datasets, which may explain the variable performance quality across different agricultural contexts and field patterns.
The visualizations below show the actual output from each model on the same agricultural area. Notice how different models detect varying numbers of boundaries.
Live comparison showing detection quality and performance (click to enlarge)
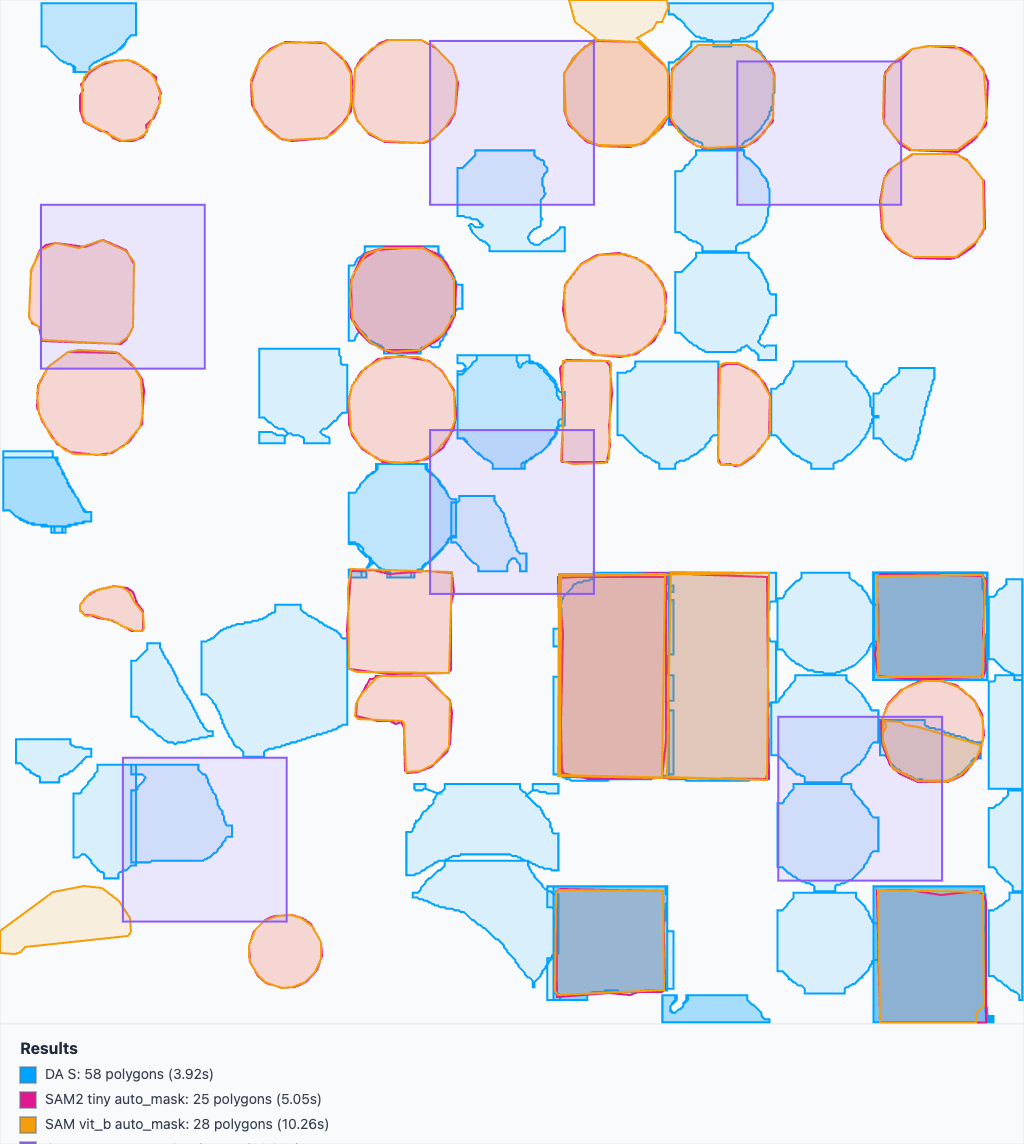
Polygon boundaries only - clearly shows detection differences (click to enlarge)
The image below shows our internal lab's user interface displaying results from each model on identical agricultural imagery. Each model was run with different parameter configurations that we determined work well for general field boundary detection, but these parameters could be further optimized for specific image characteristics, potentially yielding different results on the same input image.
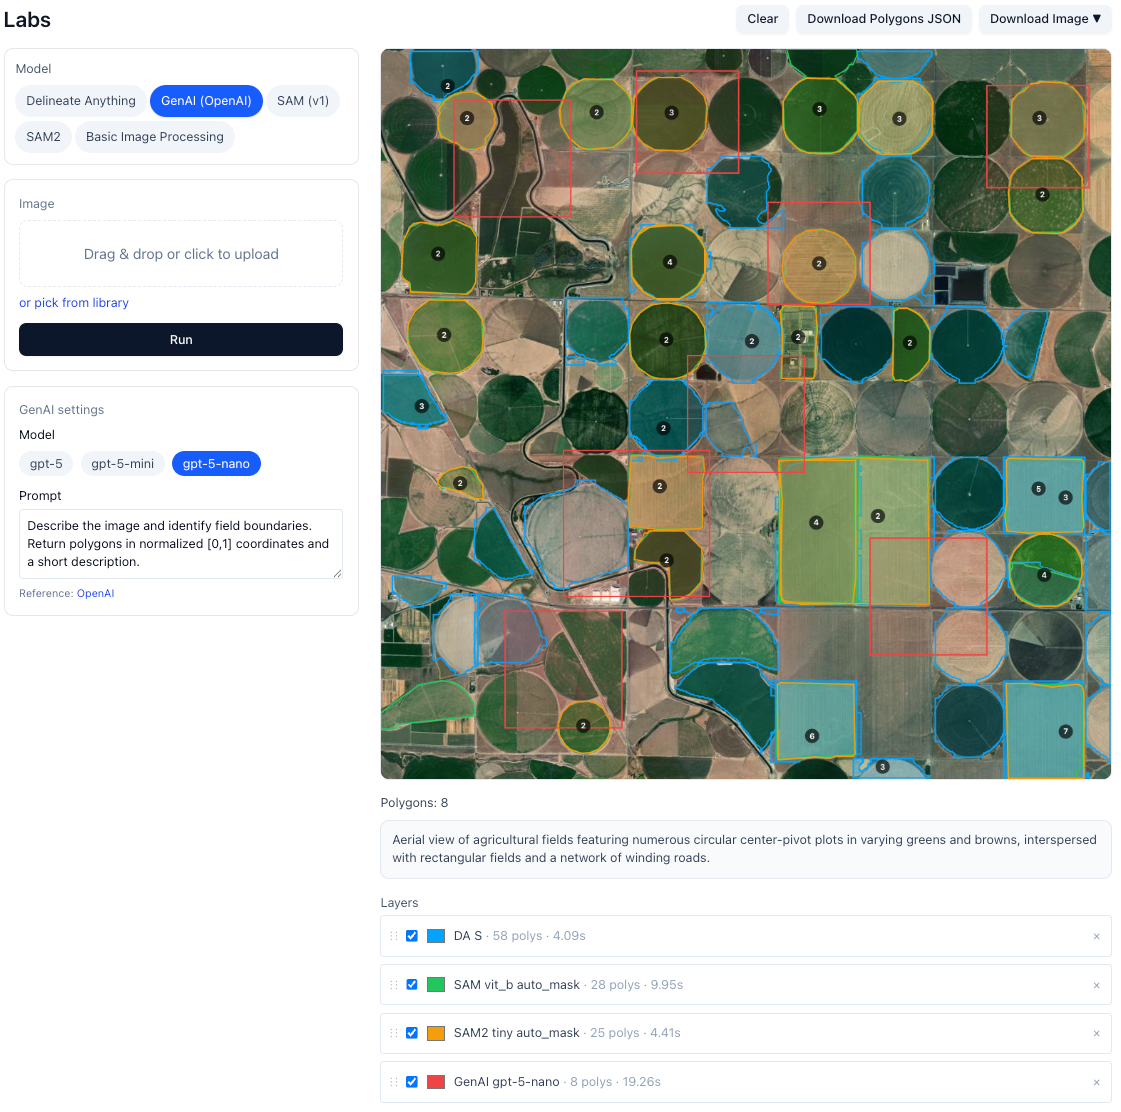
Complete comparison with terrain overlay and performance metrics (click to enlarge)